Util
The util package provides modules for convenient working with doocspie. The contents of this subpackage is shown
below, and currently, it consists of colors, functions and constants.
import doocspie


help(doocspie.util)
Help on package doocspie.util in doocspie:

NAME
    doocspie.util - Utility modules for convenient working with doocspie.

PACKAGE CONTENTS
    colors
    constants
    functions
    readonly

FILE
    /home/cbehrens/Home/Repositories/gitlab/doocspie/doocspie/util/__init__.py
In the following, we show how to make use of the Colors class in colors, and introduce utility functions to
generate helpful extra data from instances of particular doocspie Readout instances. Finally, the Constants
class in constants with typical physical constants in SI units is presented.
Colors
The colors module provides the Colors class, which aggregates different aesthetic and elaborate color palettes
for plotting purposes. Currently, it consists of the DESY corporate design palette (see
https://pr.desy.de/corporate_design/index_ger.html from 11/2020) and the palette of the Tango Desktop Project (see
https://en.wikipedia.org/wiki/Tango_Desktop_Project). The Colors class can be used and/or imported from the
colors module, or it can directly be imported from the util package itself. Both is demonstrated in the
following examples, and further below it is also shown that the color palettes can be imported directly without using
the aggregating Colors class.
print(doocspie.util.colors.Colors)
Colors(DESY, Tango)
from doocspie.util import Colors


print(Colors)
Colors(DESY, Tango)
Once imported, the different colors of the particular palettes can be accessed via class attributes.
DESY
As mentioned earlier, the color palettes can be accessed via the aggregating Colors class, or it can be imported
directly from the colors module as is demonstrated here for the DESY palette:
from doocspie.util.colors import DESY


Colors.DESY == DESY
True
The color palette of the DESY corporate design (from 11/2020) consists of the following colors:
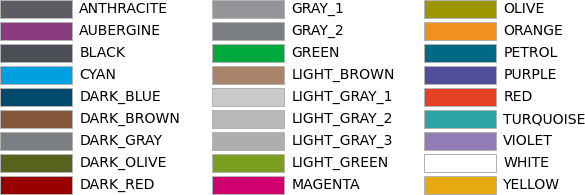
These colors are part of the DESY class, and they can be accessed via read-only class attributes:
print(Colors.DESY)
DESY(ANTHRACITE, AUBERGINE, BLACK, CYAN, DARK_BLUE, DARK_BROWN, DARK_GRAY, DARK_OLIVE, DARK_RED, GRAY_1, GRAY_2, GREEN, LIGHT_BROWN, LIGHT_GRAY_1, LIGHT_GRAY_2, LIGHT_GRAY_3, LIGHT_GREEN, MAGENTA, OLIVE, ORANGE, PETROL, PURPLE, RED, TURQUOISE, VIOLET, WHITE, YELLOW)
Colors.DESY.CYAN
(0, 0.6235294117647059, 0.8745098039215686)
The class attributes are implemented as being read-only (immutable), and thus they cannot be set:
try:
    Colors.DESY.ORANGE = (0, 0, 0)
except AttributeError as err:
    print(err)
cannot set attribute
All colors are encoded by means of the RGB color space with values in the interval \([0, 1]\). Some APIs require RGB colors in the interval \([0, 255]\) though, and this can simply be realized via:
tuple(int(255 * c) for c in Colors.DESY.CYAN) # generator comprehension
(0, 159, 223)
or by means of Python’s list comprehension if tuples are not the collection of choice:
[int(255 * c) for c in Colors.DESY.CYAN]
[0, 159, 223]
Tango
The color palette of the Tango Desktop Project consists of the following visually appealing colors:
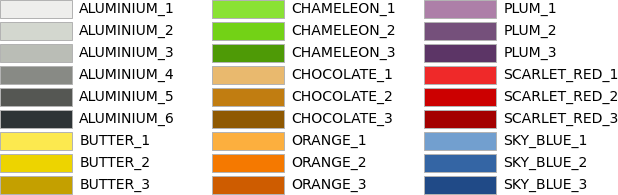
These colors are part of the Tango class, exemplarily imported from the colors module this time:
from doocspie.util.colors import Tango


print(Tango)
Tango(ALUMINIUM_1, ALUMINIUM_2, ALUMINIUM_3, ALUMINIUM_4, ALUMINIUM_5, ALUMINIUM_6, BUTTER_1, BUTTER_2, BUTTER_3, CHAMELEON_1, CHAMELEON_2, CHAMELEON_3, CHOCOLATE_1, CHOCOLATE_2, CHOCOLATE_3, ORANGE_1, ORANGE_2, ORANGE_3, PLUM_1, PLUM_2, PLUM_3, SCARLET_RED_1, SCARLET_RED_2, SCARLET_RED_3, SKY_BLUE_1, SKY_BLUE_2, SKY_BLUE_3)
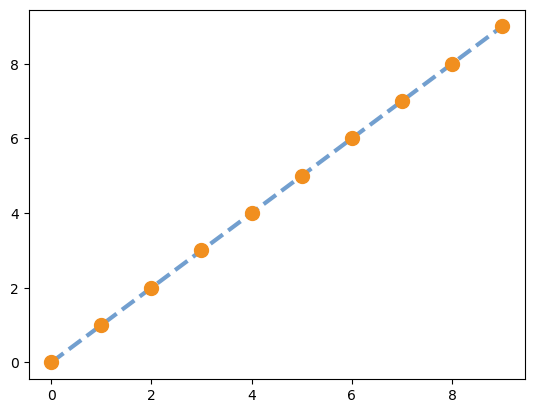
A typical use case of the doocspie color palettes is presented in the following, where as simple plot of two different curves is shown. The colors of both palettes are being used in this plot.
import matplotlib.pyplot as plt


plt.plot(range(10), "--", linewidth=3, color=Colors.Tango.SKY_BLUE_1)
plt.plot(range(10), "o", markersize=10, color=Colors.DESY.ORANGE);
Functions
The functions module provides commonly used utility functions, and its contents is shown below:
help(doocspie.util.functions)
Help on module doocspie.util.functions in doocspie.util:

NAME
    doocspie.util.functions - Utility functions for convenient working with doocspie.

DESCRIPTION
    This module provides the utility functions for convenient working with the doocspie output.

FUNCTIONS
    get_image(readout, swap_bytes=False)
        Get the image for a readout object of a given image-like DOOCS byte array property.

        Args:
            readout (Readout): The readout object of image-like DOOCS byte arrays.
            swap_bytes (bool, optional): The optional state for swapping bytes.

        Returns:
            numpy.ndarray: The image of the image-like DOOCS byte array property.

        Raises:
            TypeError: Exception for wrong 'readout.type' type.
            ValueError: Exception for wrong 'readout.meta.option' option.

    get_time_axis(readout)
        Get the time axis for a readout object of a given spectral DOOCS property.

        Args:
            readout (Readout): The readout object of spectral DOOCS properties.

        Returns:
            numpy.ndarray: The time axis of the spectral DOOCS property.

        Raises:
            TypeError: Exception for wrong 'readout.type' type.

FILE
    /home/cbehrens/Home/Repositories/gitlab/doocspie/doocspie/util/functions.py
In the following, we show how to transform one-dimensional (1D) DOOCS byte arrays into corresponding 2D images and how to return time axes from spectral DOOCS data types.
get_image
The get_image function transforms image-like DOOCS 1D byte arrays into 2D images taking into account the byte
endianness and the image’s underlying type, which can represent either a ‘jpeg’, ‘8-bit’ or ‘16-bit’ image. The optional
swap_bytes parameter controls the applied endianness. The get_image function expects a doocspie Readout
instance and returns a numpy.ndarray. Here, we demonstrate how to read out a 1D byte array, and transform it into a
corresponding 2D image:
byte_array_readout = doocspie.get("TTF2.FEL/BLFW1.CAM/BL0M0.CAM/IMAGE")
image = doocspie.util.get_image(byte_array_readout)

print("shape of input byte array:", byte_array_readout.data.shape)
print("shape of returned image:", image.shape)
shape of input byte array: (940800,)
shape of returned image: (960, 980)
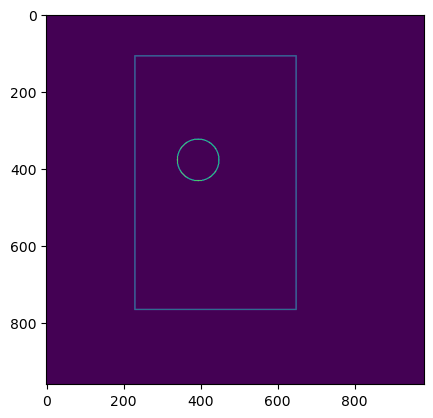
This is just an example, and the 2D image of this unspectacular 1D byte array is plotted here:
plt.imshow(image);
The DOOCS data type representing the byte array must be of type ‘A_BYTE’ as is revealed here:
try:
    doocspie.util.get_image(doocspie.get("TTF2.FEL/BLFW1.CAM/BL0M0.CAM/IMAGE_EXT"))
except TypeError as err:
    print(err)
readout.type must be of type 'A_BYTE'
get_time_axis
The time axis of DOOCS spectral types can be calculated via the get_time_axis function. This utility function
expects a doocspie Readout instance and returns a numpy.ndarray. The following example presents the readout of
a spectrum and the printout of its time axis calculation:
spectrum_readout = doocspie.get("TEST.DOOCS/UNIT_TEST_SUPPORT/PY_DOOCS/SPECTRUM")
time_axis = doocspie.util.get_time_axis(spectrum_readout)

print("the first 10 elements of the time axis:", time_axis[:10])
the first 10 elements of the time axis: [0. 0.1 0.2 0.3 0.4 0.5 0.6 0.7 0.8 0.9]
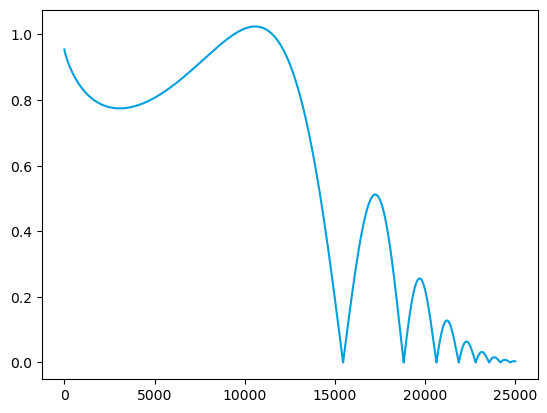
The typical use case of get_time_axis, e.g. in conjunction with Colors, is for plotting purposes:
plt.plot(time_axis, spectrum_readout.data, color=Colors.DESY.CYAN);
The required DOOCS data type for get_time_axis must be either ‘SPECTRUM’ or ‘GSPECTRUM’:
try:
    integer_array = doocspie.get("TEST.DOOCS/UNIT_TEST_SUPPORT/PY_DOOCS/INTEGER_ARRAY")
    doocspie.util.get_time_axis(integer_array)
except TypeError as err:
    print(err)
readout.type must be of type 'SPECTRUM' or 'GSPECTRUM'
Constants
The constants module provides the Constants class, which provides typical physical constants for calculation
purposes and they are given in SI units. The Constants class can be accessed from the constants module, or it
can directly be imported from the util package itself as is shown here:
from doocspie.util import Constants

print(doocspie.util.constants.Constants)
Constants(ELECTRON_MASS, ELEMENTARY_CHARGE, PLANCK_CONSTANT, SPEED_OF_LIGHT, VACUUM_PERMEABILITY, VACUUM_PERMITTIVITY)
The constants of this class can be accessed via class attributes as is demonstrated below:
Constants.SPEED_OF_LIGHT # in m/s
299792458
The class attributes are implemented as being read-only (immutable), and thus they cannot be set:
try:
    Constants.SPEED_OF_LIGHT = 23
except AttributeError as err:
    print(err)
cannot set attribute